How to Import and Visualize Vector Data in Google Earth Engine?
We can create a list of features by declaring a JavaScript variable in the earthengine JavaScript code editor.
// Make a list of Features.
var features = [
  ee.Feature(ee.Geometry.Rectangle(30.01, 59.80, 30.59, 60.15), {name: 'Voronoi'}),
  ee.Feature(ee.Geometry.Point(-73.96, 40.781), {name: 'Thiessen'}),
  ee.Feature(ee.Geometry.Point(6.4806, 50.8012), {name: 'Dirichlet'})
];

// Create a FeatureCollection from the list and print it.
var fromList = ee.FeatureCollection(features);
print(fromList);
The features in the feature collection have no need for the same geometry type or the same properties.
An individual feature is also treated as a FeatureCollection in the earth engine.
// Create a FeatureCollection from a single geometry and print it.
var fromGeom = ee.FeatureCollection(ee.Geometry.Point(16.37, 48.225));
print(fromGeom);
Earth engine stores the vector data of points, lines, polygons, multipoint, multipolygon, etc., as a table. We can upload the vector data of different formats like shapefile, geojson, etc., to earthengine and gee store those data in tabular format. We can also import the uploaded vector data from the earth engine asset to the code editor as FeatureCollection.
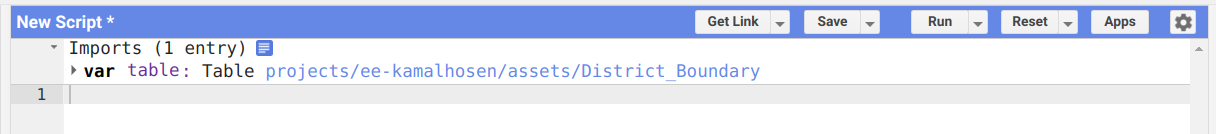
To import table data, navigate to the asset folder and mouse on the table that you want to import. By mouse hovering over the table, you will see a right arrow appear.

Click on the arrow, and it will import into the script editor by defining a default variable table. We can rename the default variable by clicking on it.
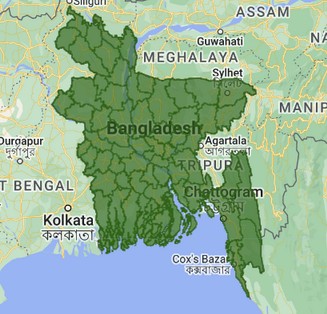
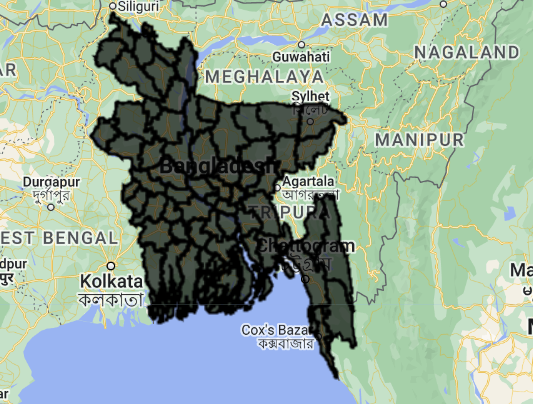
To visualize the FeatureCollection, we need to add it to map.
Map.addLayer(table, {}, 'District Boundary');Here, we add a table to the map by defining the table data source name, default visualization {} and map layer name ‘District Boundary’. The default visualization will display the vectors with solid black lines and semi-opaque black fill.
We can change the default color by passing the color name or values.
Map.addLayer(table, {color: 'red'}, 'District Boundary');
To reduce the line width of the boundary, we can use featureCollection.draw() function to add stroke-width.
Map.addLayer(table.draw({color: '006600', strokeWidth: 1}), {}, 'drawn');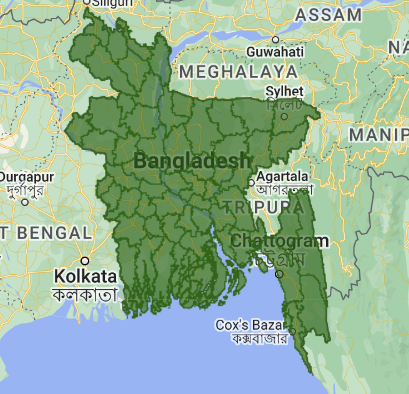
Share To
About Author
- Kamal Hosen
Geospatial Developer | Data Science | PythonA passionate geospatial developer and analyst whose core interest is developing geospatial products/services to support the decision-making process in climate change and disaster risk reduction, spatial planning process, natural resources management, and land management sectors. I love learning and working with open source technologies like Python, Django, LeafletJS, PostGIS, GeoServer, and Google Earth Engine.